The Great Decoupling
Puerto Rico's divergence from mainland economic performance.

Puerto Rico’s economy has long been closely linked to the fortunes of the United States, and the global economy. During the 20th century, Puerto Rico’s economy closely mirrored developments on the mainland. Much like the rest of the industrialized world, Puerto Rico suffered recessions in 1973-75, 1980-82, 1990-91, 2001-02, and during the Great Financial Crisis. However, in stark contrast to other recessionary episodes, Puerto Rico’s economy did not begin to recover in late 2009 along with the rest of the United States (and the industrialized world). Instead, Puerto Rico’s economy was permanently knocked off its previous growth trend, which led to large outward migration which exacerbated the its economic woes. By focusing on the 1990s and 2000s, the decades proceeding 2008 GFC, I will show that Puerto Rico’s economic trends closely mirrored the US mainland. Only after 2008 did a great decoupling occur, and Puerto Rico’s economy assumed a downward trend not experienced on the mainland.
1990s boom years and Housing Bubble
During the 1990s and 2000s, bank credit expanded rapidly. With a strong economy, households and firms confidently took on debt. With soaring house prices, there was a credit bonanza in the real estate sector. This continued well after the phase out of section 936 began in 1996. If this sounds familar it should. The exact same thing was occuring on the US mainland.
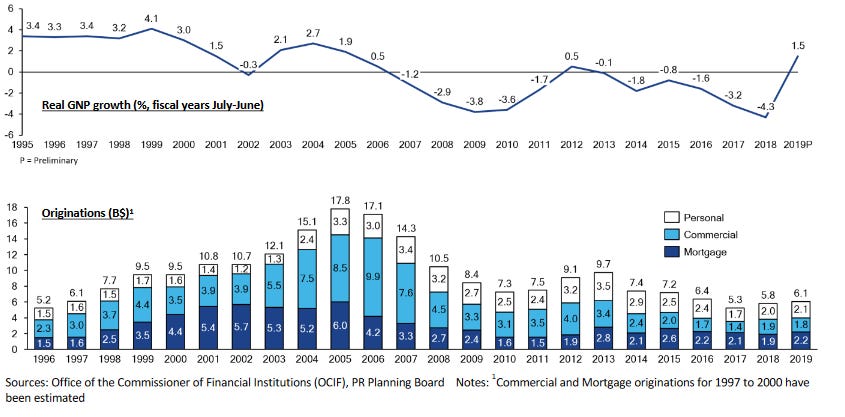
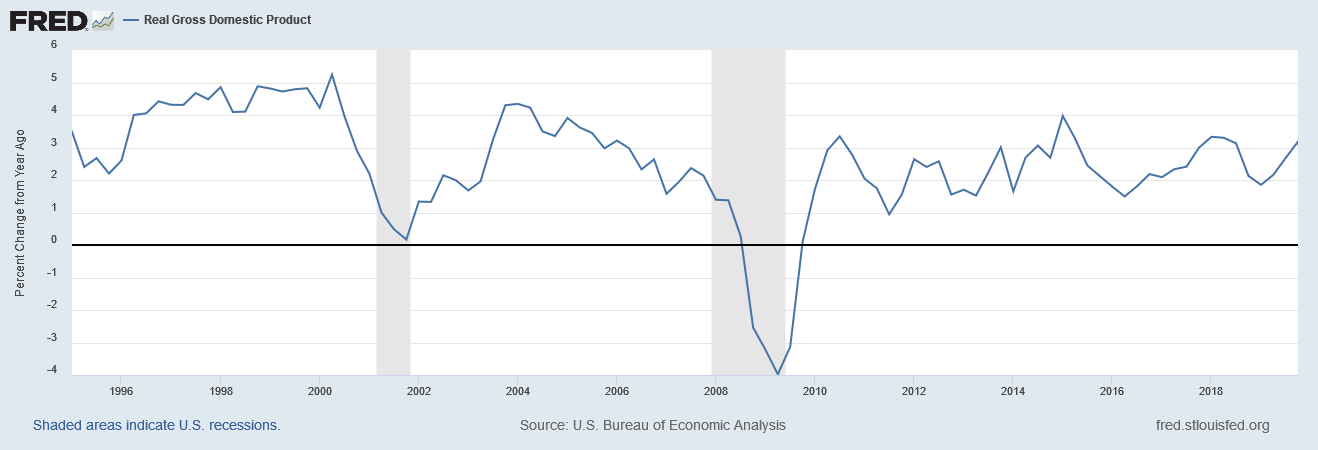
The US mainland mirrored Puerto Rico both in terms of growth of the overall economy and mortgage credit. Growth was strong in the second half of the 1990s, there was a recession in 2001, and resumed at a slower pace in the 2000s.
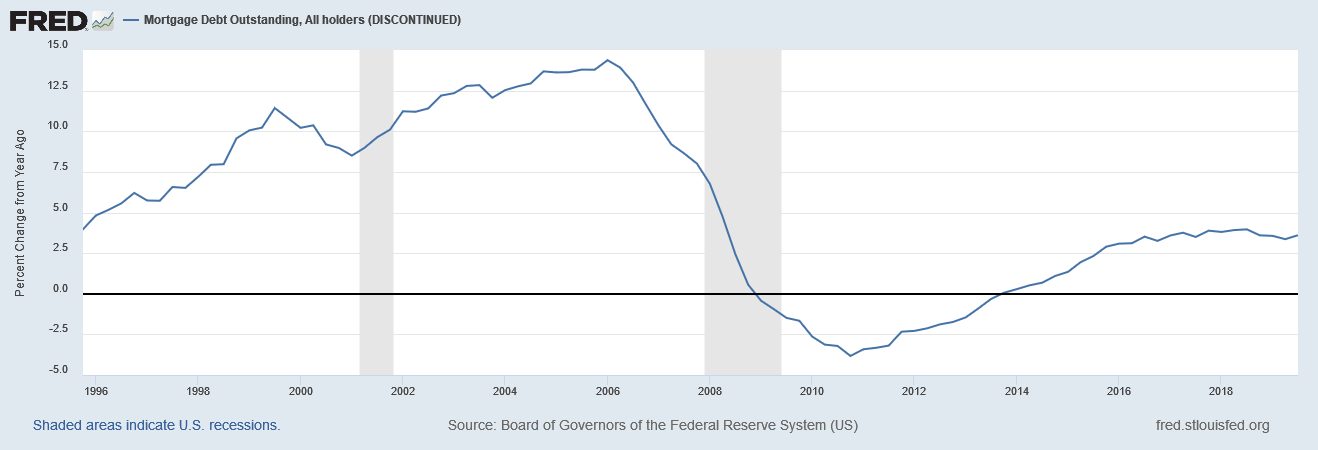
Mortgage credit in Puerto Rico and the US mainland also grew at a similar pace. Accelerating in the 1990s as house prices increased, then soaring during the post 2001 recession housing boom, before collapsing in the wake of the GFC. (Note, the data for Puerto Rico only shows originations, that is the creation of new mortgage loans. The US data shows new loans minus the existing mortgage debt which was paid off. Until 2013, debt payoff outpaced the creation of new loans. In any event, both graphs show the collapse of mortgage credit post GFC)
Next, lets look at house price indices for both the US mainland and Puerto Rico. The levels are different, but the trends match exactly prior to 2008 and then diverge.
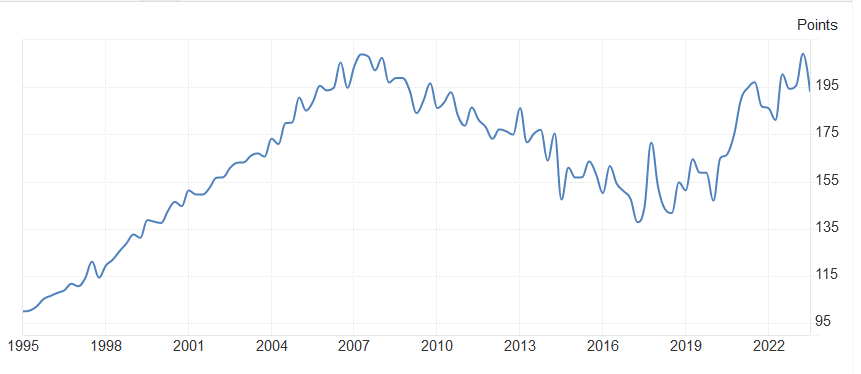
Above we see an index of Puerto Rico house prices. (1995=100) Between 1995 and 2007, prices roughly doubled. Then they started falling, and crucially, kept falling after 2012, the year that house prices in the rest of the US began to recover. Only due to the post COVID housing boom, which also affect Puerto Rico, did house prices finally recovery to nominal levels seen in 2008.
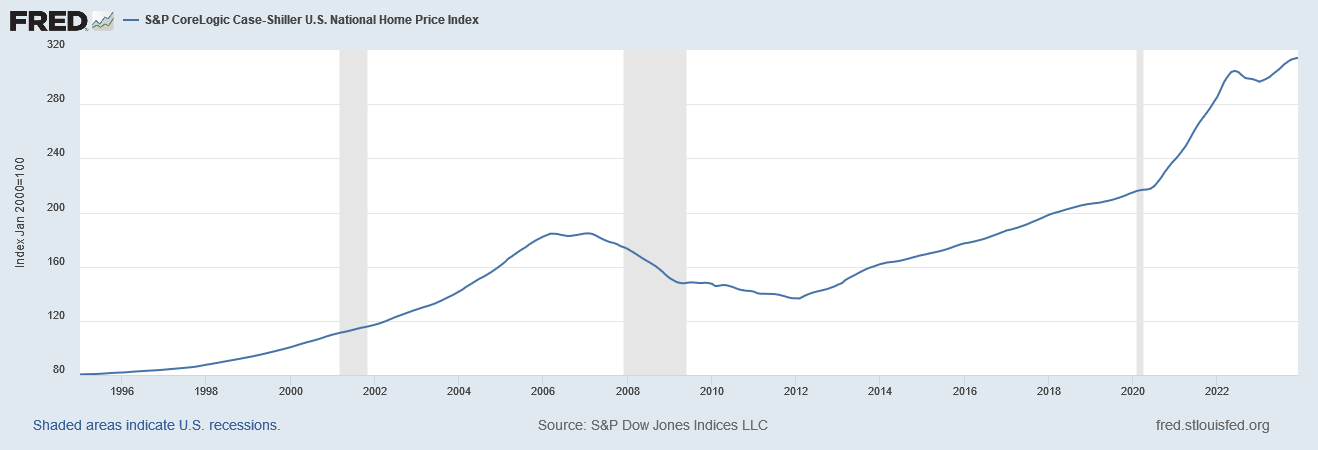
The mainland US experienced a bigger run up in house prices prior to 2007-08. And the initial decline in prices was actually a bit steeper than in Puerto Rico. However, unlike Puerto Rico, house prices began to recover by 2012.
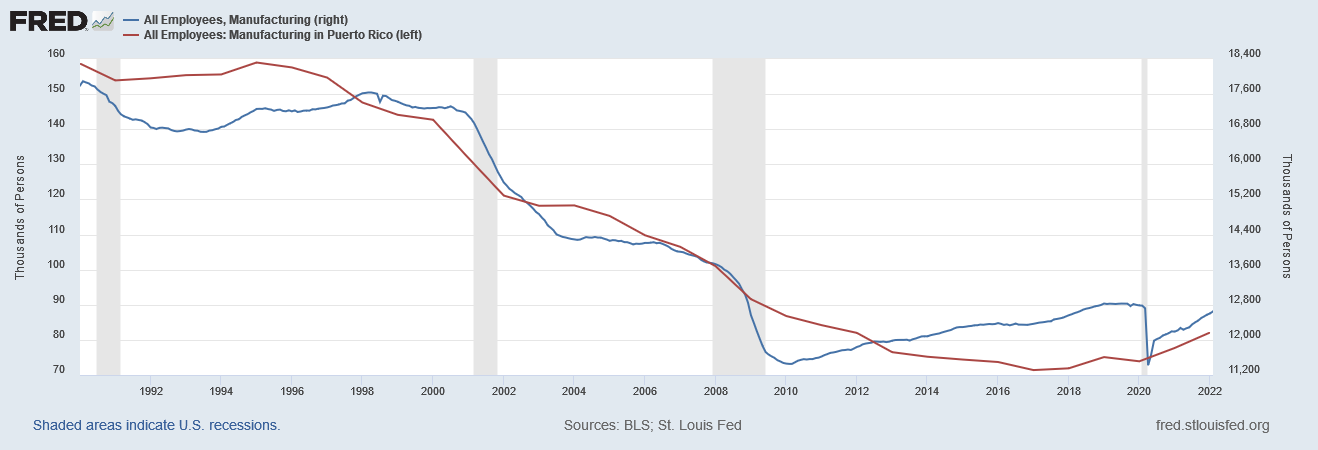
Finally, lets look at employment. Both the US mainland saw little job growth in manufacturing in the 1990, and both experienced a massive decline in manufacturing employment in the 2000s. However, a small recovery began in US manufacturing employment around 2010. On the island, manufacturing jobs simply kept falling, though have recovered somewhat since 2020.
That said, both the island and the US as a whole experienced robust job growth in the 1990s and 2000s, despite manufacturing job losses. That means that the service sector job gains more than made up for manufacturing job losses. In fact, Puerto Rico had stronger job growth than the US mainland from 1990 to 2006. In particular, the island’s labor market recovered more quickly from the 2001 recession.
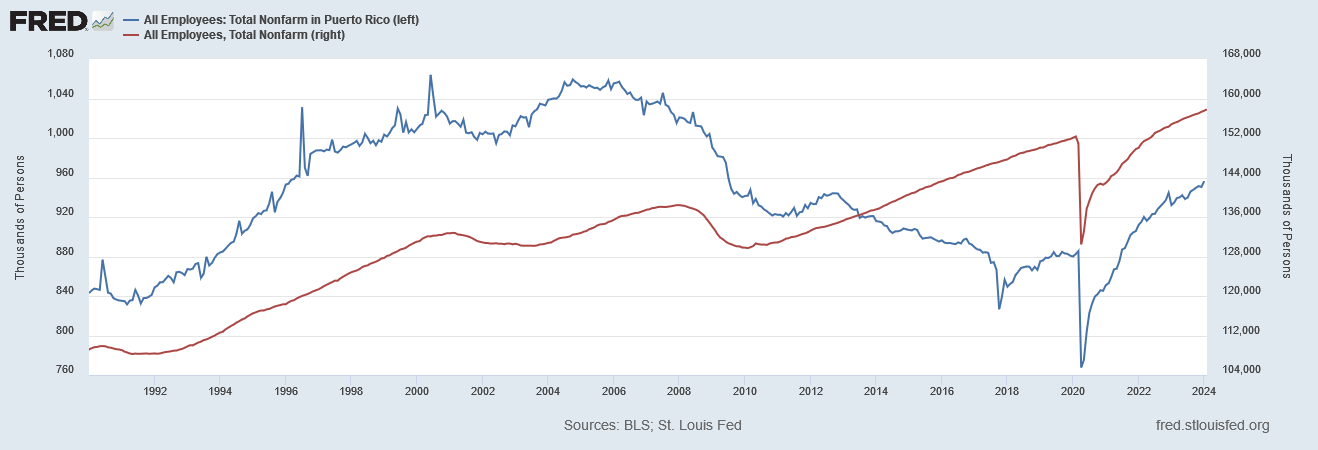
This simple fact calls into question the proposition that loss of manufacturing jobs doomed Puerto Rico. Despite a stagnant and then shrinking manufacturing sector in the 1990s and the 2000s, Puerto Rico had robust growth in both the overall economy and level of employment.
In fact, if we removed the labels and numbers on the axes, it would be had to distinguish which line in each graph was Puerto Rico and which was the US as a whole, prior to 2010. Both the island and the mainland more or less followed the same trend.
The graphs really only diverge after the great recession. Puerto Rico simply never started to recovery. This is what I have dubbed the Great Decoupling. And strangely enough, post COVID, the economic trends again show a strikingly similar pattern on a variety of economic indicators.
The Great Decoupling
Before 2008, Puerto Rico’s economic performance mirrored the US mainland, and the rest of the world. After the Great Recession, Puerto Rico’s economy never began to recover, and didn’t hit its trough until after Hurricane Maria. Despite the high correlation between Puerto Rico’s economic performance and that of the US mainland, many try to tell a story in Puerto Rico specific terms, usually surrounding the repeal of section 936 of the internal revenue code. In reality however, Puerto Rico’s economy performed strongly during the decade which section 936 was eliminated and phased out. And crucially, net job creation accelerated even as manufacutring job growth was flat or negative.
The causes of the Great Decoupling are hard to pin down but there are several promising hypotheses. One is outward migration, which has always shot up during recessions, was particularly high during the Great Recession. Another could be Puerto Rico’s large debt load going into the GFC. In our next post we will examine these ideas to try to further understand the Great Decoupling.