Stop Comparing Home Prices With Stock Prices
Once imputed rents are considered, total returns to housing and stocks are about a wash

Happy 2026. After taking a break for the holidays, I am now back to my regular schedule of roughly two posts a week. Thanks for all the support, and please consider subscribing if you have not already.
The Famous Chart
Every so often, a chart like this makes the rounds on social media.
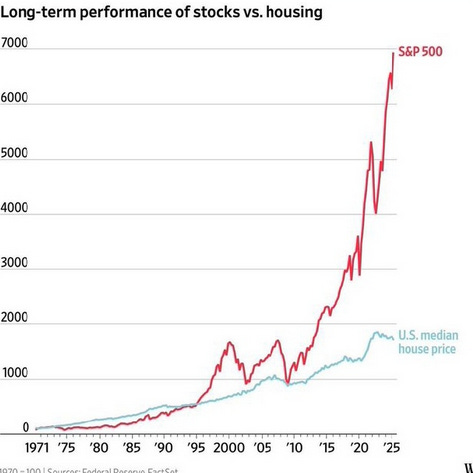
Here, the long run price of stocks in the S&P 500 are contrasted to the US median home price. The implication is that homes are bad investment and that you are better off renting and owning more stocks. This wrong because all charts of this type ignore imputed rent, or the rent that homeowners avoid paying because they own their homes. Once this figure is considered, even before considering subsidized leverage or tax advantages, the gap in returns to stocks and homes disappears.
Imputed Rent
A penny saved is a penny earned, and more you don’t have to pay to a landlord because you live in your own home is the save as money that make. Every month, homeowners collect a “dividend” because unlike renters, they don’t need to write a check to their landlords. Yes, about 60 percent of homes in the United States are mortgaged, and so owners of these properties must cut a check to their banks, but leverage need not concern us here.1 Anyways, the rent that homeowners don’t have to pay was 2.02 trillion dollars in 2022. And the total value of all owner occupied housing in that year was about 41 trillion dollars. Thus, homeowners “earned” about a 4.9 percent dividend on their investment in housing in 2022. This actually historically low, since 2021 and 2022 saw huge surges in home prices which outpaced increases in rents.
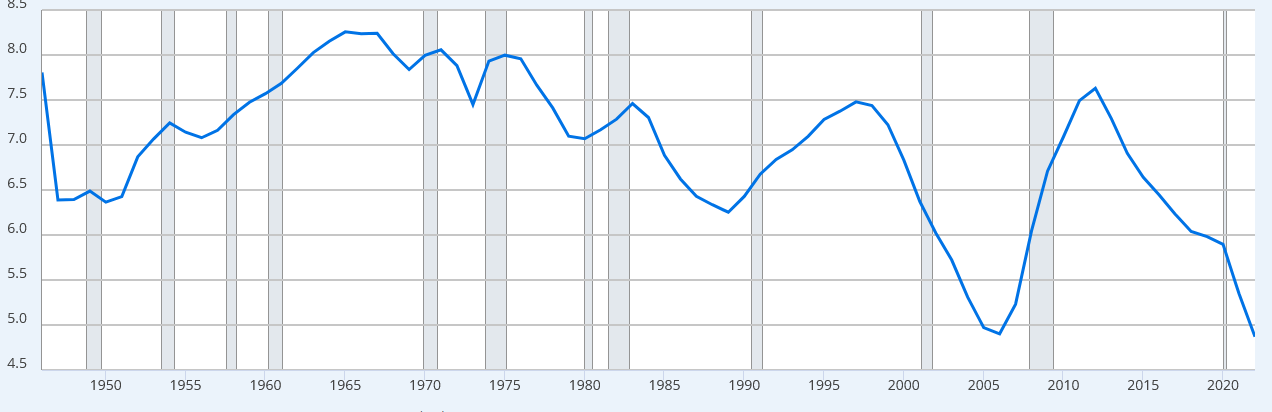
This chart shows the imputed rents as a share of total owner-occupied housing wealth. Except for two periods of runway housing price growth (2004-06 and 2020-2022), the aggregate “yield” (imputed rent divided by value) of owner-occupied housing has tended to be closer to 7 percent on average.
So if we combine this 7 percent yield with about 4 percent historical home price appreciation, we get a total return of 11 percent. If we subtract 1 percent for property taxes, and 1 percent for expenses, we are at 9 percent. This puts us smack dab in the middle of ranges for total long run returns for major US stock market indices of 8-10 percent, depending on the start date. No, homes do not under-perform stocks even before considering subsidized leverage or tax advantages.
Leverage and Taxes
Just for fun however, we can consider the effects of leverage and taxes. In the United States, mortgage interest is deductible against ordinary income, and for a married couple, the first 500 thousand in capital gains are tax free. Thus, for the majority of households, owning a home will likely deliver a somewhat higher after-tax return than the S&P 500. Of course, diversification is important and it is riskier to own only a single asset versus a diversified portfolio of stocks. But again, the idea that housing somehow greatly under-performs the stock market is bunk.
Conclusion
The returns to housing are not meaningfully different from long run stock market returns once imputed rents are considered. This is before any of the other tax advantages of home ownership are considered. Renting instead of owning is fine if done out of necessity or for lifestyle reasons. But it is not some secret financial hack.
So much analysis of the "buy versus rent” conundrum is focused on leverage and it’s wrong. Any investment can be leveraged. You can borrow money to buy stocks too. So a real apples to apples comparison should look at unleveraged investments in stocks and housing. True, in the United States, borrowing money to purchase a home is subsidized and enjoys certain tax advantages, especially for high income individuals, but as we shall see, even without considering leverage, homes do not meaningfully under-perform stocks.